

Flow Duration Curve
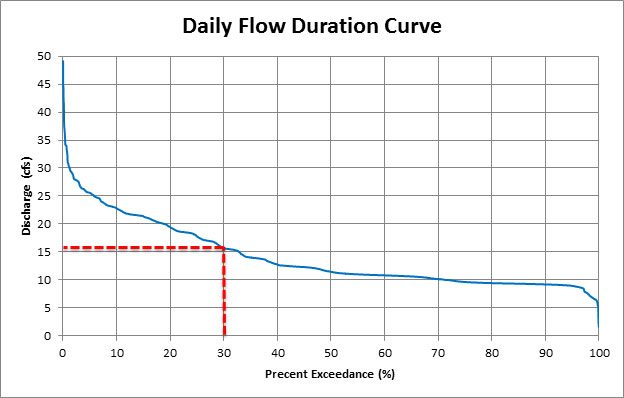
Flow may be very high at some points throughout the year, especially during peak run-off periods or after exceptionally rainy periods, so measuring flow multiple times throughout the planning period is vital. Designing a hydropower system to handle peak flows that only occur just a few days a year is unlikely to be cost-effective. Sizing a system that uses flows that are available for a majority of the water season is more cost-effective. The variance in annual flow can be depicted graphically through a flow duration curve, such as Figure 26. Use of a flow duration curve can allow for more accurate small hydro planning by considering maximum and minimum flows and observing trends in consecutive yearly data. Flow duration curves graphically depict the relationship between channel flow and the percentage of time that specific flow is exceeded.
Design Flow
The design flow is the flow at which the turbine operates most efficiently and is the maximum flow rate the hydro system should operate at for an extended period of time. When looking at the flow duration curve, an initial estimate of the design flow for a small hydro system will typically be the flow associated with an exceedance value of 30 percent. For the example in Figure 28, the design flow at 30 percent exceedance would be approximately 15 cubic feet per second (cfs). This is a general rule-of-thumb and can vary depending on the shape of the flow duration curve. To size the system more accurately, each system will have to be analyzed individually and the costs and benefits compared among potential turbines. Generally, the design flow can be exceeded by approximately 10 percent; however, running the turbine at this higher flow rate should not be a frequent occurrence as turbine efficiency will decrease and excessive wear or damage to the turbine or components may result.
Measuring Head
Head is representative of the water pressure created by the difference in elevation between the intake of the penstock and the hydro turbine discharge. Head can be applicable to two different values, gross head and net head. The gross head is quantified by the change in water elevation prior to the commencement of any water flow. Energy is lost due to friction of water flowing through the penstock. The available head for hydropower generation is less than the gross head. After the energy loss has been accounted for, the resulting adjusted head, called net head, represents the pressure at the bottom of the pipeline during water flow. Head loss can vary depending on the penstock size and material; however, for a well-designed system the net head will generally be 85-90 percent of the gross head. viii The net head represents the actual amount of head available for use in the turbine. The relationship between gross head and net head is as follows:
Gross Head – Head Loss = Net Head
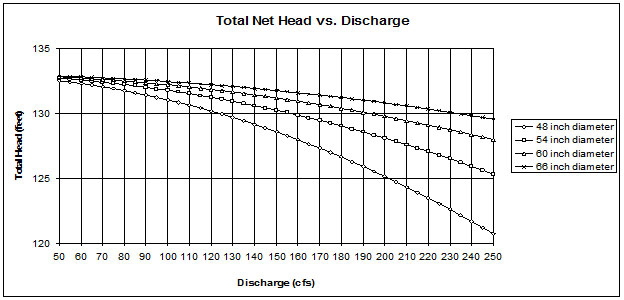
Calculating head loss in a pipeline can be complicated, and seeking help from a professional is recommended; however, in general terms a larger diameter penstock will reduce head loss, as shown in Figure27. Energy losses in a penstock result from friction losses and minor losses. Friction loss in the penstock is a function of penstock diameter, length, flow rate, and pipe material. An increase in penstock diameter will reduce friction loss; whereas, an increase in flow rate and/or penstock length, will increase friction losses. Minor losses in the penstock are attributed to any bends, fittings, valves, and pipe entrance and exits. The total energy loss in the pipeline is the sum of the friction losses and minor losses. Even though head losses are less in larger penstocks and can deliver more power to the turbine, larger penstocks are also more expensive. There is a tradeoff between head loss and system cost. A good place to start when sizing a penstock is to keep the flow velocity in the pipe less than 10 feet per second (fps). The flow velocity can be calculated by dividing the flow rate by the cross-sectional area of the pipe. According to Canyon Hydro, which is a prominent U.S.-based manufacturer of small hydropower systems, a good rule of thumb is to size the pipe such that no more than 10 to 15 percent of the gross head is lost due to pipe friction. xiv
There are two accurate methods for measuring head – direct distance measurement and water pressure.
i) Direct Distance Measurement[i]
The most accurate direct distance measurement is a topographic survey conducted by a professional land surveyor. A similar method is to use a surveyor’s transit, a contractor’s level on a tripod, or a level taped to a straight board to measure gross head. A surveyor’s rod or a pole with graduated measurements is also required (measuring tape affixed to a 20-foot section of PVC pipe works well). Direct measurement requires an assistant. Make a series of vertical measurements using the transit level and the vertical measuring pole. Make sure each transit setup is exactly level, and ensure the measuring pole is vertical. Keep detailed notes at each step and then add up the series of measurements (A, B, C, D, etc.) to find the gross head. This method may not be practical if the pipeline is long.
ii) Water Pressure Measurement
Head can also be calculated using some type of pressure meter, such as a piezometer or pressure gage. By utilizing a pipe or tube completely filled with water that spans the full elevation drop, pressure can be measured at the bottom or the outlet. One pound per square inch (psi) of pressure accounts for approximately 2.31 feet of vertical head. When using this method, use a continuous pipe or tube although segments can be used if care is taken to eliminate any leakage at the connections. If a single span of tubing is unavailable, multiple readings can be taken along the elevation drop; however, this method will greatly increase chances for error. Since there is no water flowing out of the pipe when this pressure measurement is taken, this is a measurement of the gross head.xii
As an alternative, pressure readings across a pressure reducing valve (PRV), say on a municipal pipeline, can be used to determine the net head available for hydropower. If the PRV is on a penstock that will supply the turbine and the upstream and downstream pressure readings are recorded at the design flow in the pipeline, then the difference between the two pressure readings can be correlated to an accurate measurement of the net head.
[i] Source: Guide to Hydropower An Introduction to Hydropower Concepts and Planning, Canyon Hydro (www.canyonhydro.com)